
The returns on quality early learning are real and well-evidenced, but they unfold over decades, not quarters. A child is only three or four years old once, and the window that shapes language, learning and the ability to thrive does not stay open while we wait for government’s developing system to catch up. For us, impact means keeping that window open now — child by child, centre by centre — while contributing to the systems, processes and practices that will one day become the standard for every child.
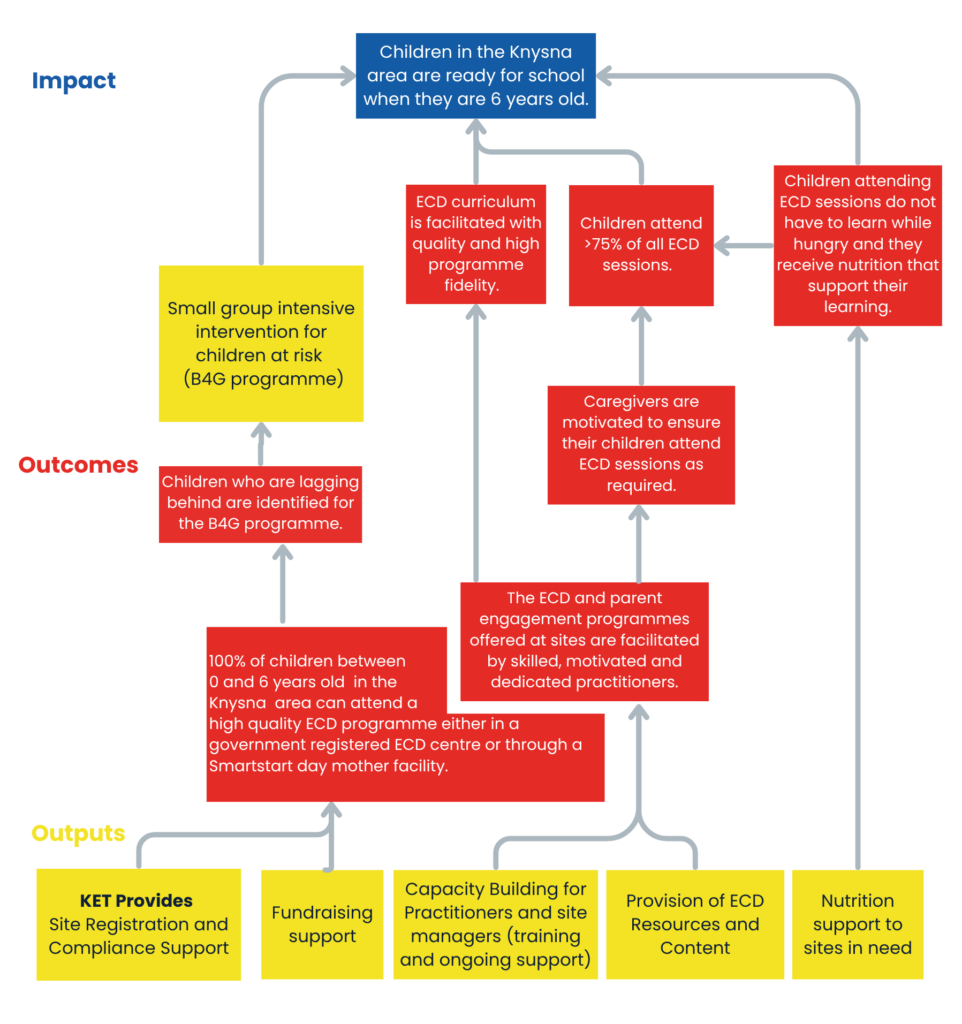
A Theory of Change helps us to understand what we need to do and how it must line up to lead us to a position of achieving impact – in our case we will know we have achieved impact if every child in the Knysna municipality are developmentally on track and ready for school by the time they are six or seven years old.
The Status of ECD in Knysna
Knysna is a place of extraordinary beauty—and deep inequality. Beyond the forests and lagoon, many communities face high levels of poverty, unemployment, food insecurity, and limited access to quality services, with around two-thirds of residents living below the poverty line. For young children, ECD centres are often the most important support in their lives. While access to ECD facilities is relatively strong, the central challenge is ensuring that these services are of sufficient quality to meaningfully support child development.
Following is a visual summary of the current (early 2026) status of ECD services in Knysna.
ECD services available in Knysna
89 ECD facilities accross Knysna in total – in lower income (Q1-3) communities and 14 in higher-income (G4-5)
Quintile 1–3 lower-income communities
69 of 75 are KET partner sotes (92%)

Quintile 4–5 higher-income communities
6 of 14 are KET partner sotes (43%)

- KET partner site (Q1–3)
- KET partner site (Q4–5)
- Non-partner facilty
SERVING
APPROXIMATELY
3,000
children aged 0–5 across
these centres each year
BY AGE CLASS
How the ~3000 children break down across bands at KET partner centres.
16%
20%
24%
26%
15%
0–2 years
0–2 year class
2–3 years
turning 3 years old
3–4 years old
turning 4 years old
4–5 years old
turning 5 years old
Grade R
turning 6 years old
ABOUT THE QUINTILE 1–3 CENTRES
The Q1–3 centres are not purpose-built facilities. Most operate from private homes, adapted out of necessity into spaces where children can learn, play, and be safe. The women who run them do so with remarkable dedication for very little financial reward, if any.
Practitioners
~270
ECD pratitioners work across the 75 KET partner centres in Knysna – the figures below describe the conditions they work under.
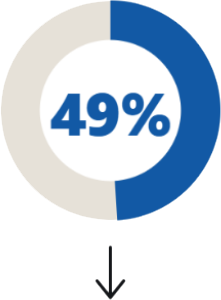
are under qualified
with little formal training in child development.
One reason: pay in the sector is exceptionally low.

earn less than R5,000 per month
for work that shapes the trajectory of a child’s entire life.
22% earn less than R3,000 per month
For context: South Africa’s national minimum wage is just above R5,000 per month – meaning most ECD practitioners earn below it.
And so practitioners move on – often after years of training and development.
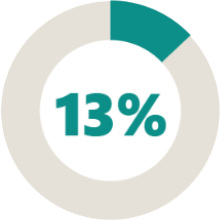
leave their centres each year
the annual attrition rate across Knysna ECD centres.
Practitioner classroom skills • snapshot, early 2026
79
practitioners observed across Knysna-Bitou ECD centres using KET’s Classroom Teacher Reflection & Performance Rubric. Mean score 56%, median 60% – range from 25% to 79%.
PERFORMANCE BAND DISTRIBUTION
How the 79 practitioners scored overall.
18%
23%
48%
11%
Needs urgent support
Low • ≤40%
14 practitioners
Getting there
Developing • 41-55%
18 practitioners
Doing well
Proficient • 56-70%
38 practitioners
Excellent
Strong • 71%+
9 practitioners
WHERE THE GAPS SIT
Mean scores across the rubic’s five domains, expressed as a % of the domain maximum.
Communication with parents
Classroom environment & safety
Teaching & learning
Professional behaviour & reflection
Observation & assessment
Practitioners score strongest in the daily, relational work – engaging parents and shaping a safe classroom – and weakest in the more reflective evidence-based practices of tracking each child’s progress and stepping back to evaluate their own teaching.
Centre sustainability
R300-R400
in monthly fees per child — yet around 30% of parents cannot pay consistently. For most principals, running a centre means navigating a constant gap between what comes in and what is needed to keep the doors open.
GOVERNMENT REGISTRATION STATUS
All 75 KET partner sites work towards full registration. Sites progress through three tiers — Bronze, Silver, and Gold.

Bronze
40%
of partner sites
Registered on the government database.

Silver
52%
of partner sites
Meets minimum norms. Re-registers every 2 years.

Gold
7%
of partner sites
Fully compliant. Only re-registers every 5 years.
ACCESSING THE GOVERNMENT ECD SUBSIDY
Only Silver and Gold sites are eligible — that’s 44 partner sites. Of those, 38 receive the per-child subsidy; 6 are still working towards it.

- 38 sites funded
- 6 not yet funded
86%
of eligible (Silver &Gold)sites are funded
51%
of all 75 KET partner sites access the subsidy
IN THE MEANTIME
Practitioners never turn a child away, even when families cannot pay. They show up every day with vision and determination, even when the odds are stacked against them.
Child outcomes
SHOWING UP — EVERY DAY
Average daily attendance across KET partner centres in 2025.
86%
Children attended on an average day.
92%
Practitioners attended on an average day.
4–5-YEAR-OLDS DEVELOPMENTALLY ON TRACK
2025 ELOM (Early Learning Outcomes Measure) assessment. Sample of 75 learners across 16 ECD centres.
72%
of Knysna’s 4–5-year-olds are developmentally on track — up from 68% in 2024. ↑
KNYSNA
72%
WESTERN CAPE
66%
NATIONAL (SA)
46%
BY DEVELOPMENTAL DOMAIN
ELOM scores out of 80, by domain – Knysna compared with the Western Cape and the country.

Children performed particularly strongly in gross motor skills, executive functioning, and socio-emotional development. Emergent literacy and language was the only domain where Knysna sat below the provincial average.
88% of children showed satisfactory levels of concentration and persistence — a key predictor of school success identified in the Thrive by Five Index.
GRADE R RESULTS · YEAR ON YEAR
2025 ELOM R assessment of 75 Grade R learners across 7 schools.
Mathematics
on track
2024
2025
↑ tripled (+50pp)
Language
on track
2024
2025
↑ nearly doubled (+28pp)
Far behind
share of learners
2024
2025
↓ sharply down (-27pp)
WHERE FOCUS IS STILL NEEDED
DataDrive2030’s report on the Grade R cohort highlights social-emotional development as an area for improvement.
35%
of children sampled did not meet the standard for social relationships.
33%
of children sampled did not meet the standard for emotional readiness.
A NOTE ON THE DATA
Outcomes are reported from KET’s 2025 ELOM and ELOM R assessments. While direct year-on-year comparison is limited by partial sample overlap and a small cohort of 75 learners per group, the 2025 results across both age groups were notably more positive than 2024.
Nutrition
1,346
children received a hot, nutritious meal each day through KET’s feeding scheme in 2025 — nearly 6× the number reached in 2022.
CHILDREN FED EACH YEAR
Annual reach of the KET feeding scheme, 2022–2025.

2022
232
0
2023
278
+20%
2024
444•
+60%
2025
1,346•
x3 in one year
A SECOND SIGNAL: ZERO STUNTING
None of the children included in the 2025 ELOM sample were stunted — an encouraging indication that consistent meals, alongside good ECD support, are reaching the children who need them most.
What parents say
276
parents across 48 KET partner sites responded to a WhatsApp survey in November 2025.
OVERWHELMINGLY SATISFIED
Headline parent sentiment, all 48 sites combined.
97%
are very happy with their ECD centre
95%
find fees reasonable
82%
receive weekly WhatsApp updates from their centre
WHAT DIFFERENCE HAS THE CENTRE MADE?
Parents could tick all that apply — 263 responses to this question.
My child is learning more — colours, numbers, language:
My child enjoys going to school:
My child is more confident and social:
My child eats better and is healthier:
WHERE TO DEEPEN THE WORK
The clearest opportunities across both groups are nutrition guidance, home-learning support, and deeper parental involvement beyond meetings and events.